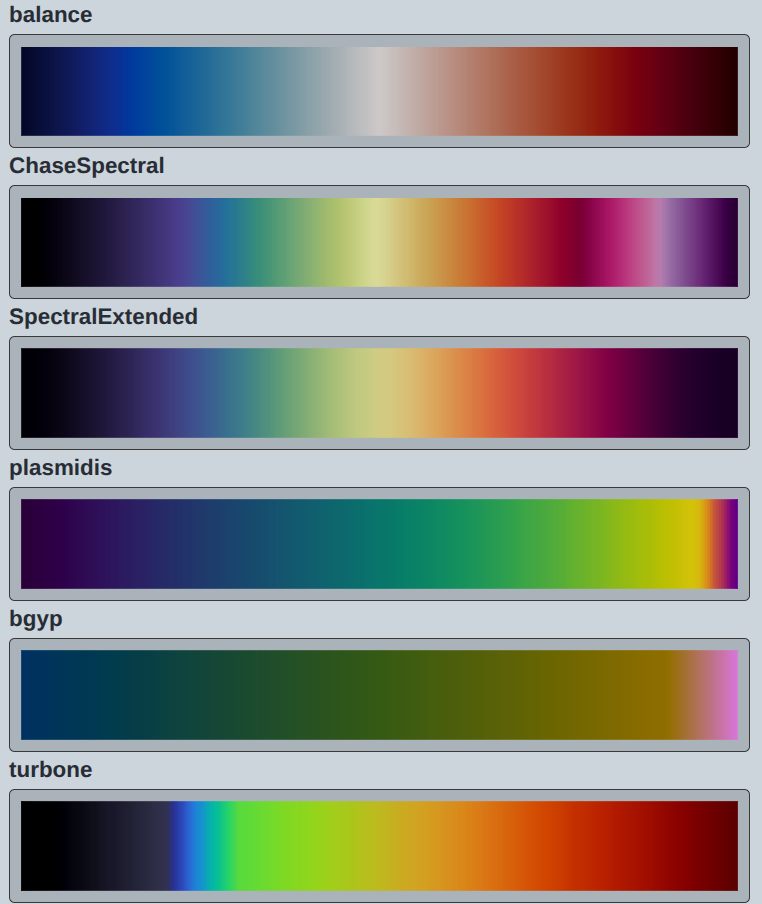
These are accessible radar colormaps, some of which I’ve contributed to.
These links can be used to import them directly into RadarScope.
- ChaseSpectral (Reflectivity)
- cmocean balance (Velocity)
- thermal_vent (Velocity)
- matplotlib cubehelix (Spectrum Width)
- plasmidis (Correlation Coefficient)
- plasmidis (Correlation Coefficient)
- turbone (Differential Reflectivity)
A few years ago, I had an opprotunity to participate in the development and eventual proposal of a radar reflectivity colormap that attempted to balance the trade-off between using lightness reversals to provide qualitative insights into the data, while using them sparingly and strategically to improve the accessibility of the colormaps for users with color vision deficiency. (As an added bonus, this also makes it easier to interpret when printed in grayscale).
These same principles were then applied to colormaps for correlation coefficient and differential reflectivity. While the widely used NWS colormaps are not awful for CVD in these plots, I wanted to (a) do better, even if only by a little bit and (b) have truly open-source colormaps. The oceanography community had already created the “balance” colormap in cmocean which works well for divergent variables and was integrated into py-ART for velocity, and I’ve seen many people use the matplotlib default “cubehelix” colormap for spectrum width. (As an aside, it turns out “cubehelix” is not just a colormap, but a whole system of creating colormaps).
All of our colormaps were rolled into a publication which I’m honored to be listed as an author of. This was my first real experience with publication and I’m happy it was towards something with an immediate, genuine impact for lots of people.
As I was writing this post, and discovered cubehelix was more complex than I knew, this intrigued me enough to go and play around with designing a divergent colormap based on cubehelix. I had wanted for a while to try to create a better velocity colormap than balance. A few months ago on a storm chase, one of the people with me pointed out that the extrema in velocity just become darker red or darker blue, and the lack of hue shift makes it difficult to perform qualitative analysis. This was very much in line with the original paper. I played around with cubehelix patterns from seaborn, but was unable to match balance’s accessibility. I did get viscm installed and manually designed a similar one which I’ve named “thermal vent” as it looks a bit like matplotlib’s magma on the hot side and cmocean’s deep on the cold side. It’s also linked above if you want to try it. Anectdotally, 2 of my friends that have different forms of color vision deficiency have reported that it’s easier to identify couplets and aliased velocities in hurricanes are less overwhelming. This is of course not peer reviewed, so take that for what it is.
In in the interest of spreading CVD-friendly colormaps, I have links above which are “one click” to add to the popular visualization app RadarScope. If you have at least a “Pro Tier One” (the least expensive of the subscription options) subscription, you can click the link above to add the colormaps to your radarscope app, and try them out by going to radarscope’s settings->general->color palettes.
If you’ve ponied up the $300 for GR2 Analyst, you can manually download the .pal files for use here (Click the one you want, then the download icon in the top right, drag->drop into GR2A window)
And finally if you’re using python, consider giving cmweather an install to have these available in matplotlib.